Every channel, one picture of what customers experience.
Reviews, support mail, chat, calls and surveys, read as they arrive and filed under the same themes, categories and issues. See where the experience breaks, for whom, and what it is worth.
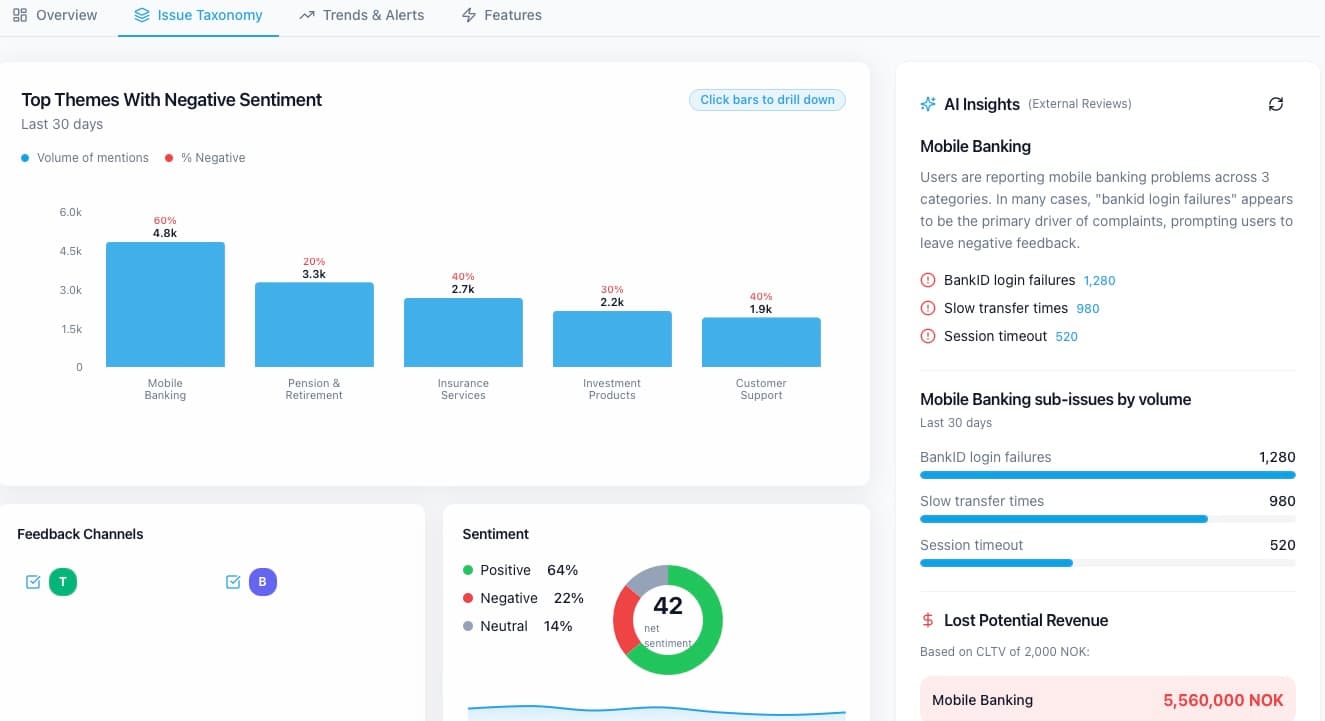
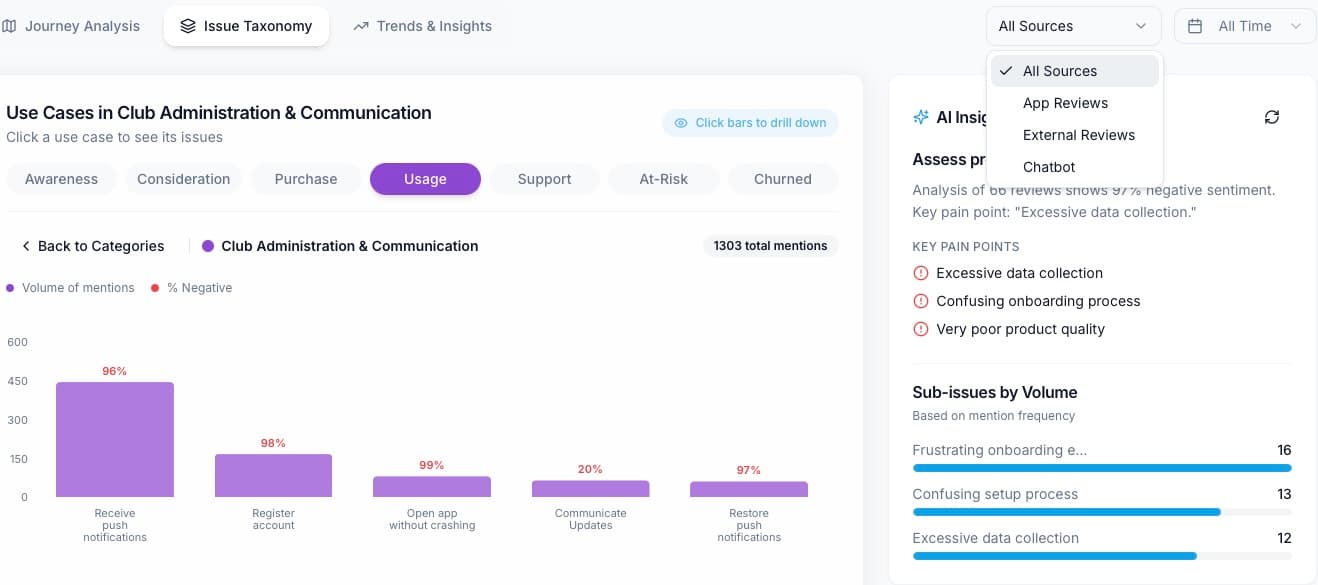
See what customers were trying to do, and where it failed.
Each signal carries the journey stage the customer was in, from awareness to churned, and the task they were attempting. Pick a stage and the chart shows which tasks fail most and what customers say about them.
- Seven journey stages, with the five funnel steps drawn as a funnel
- Use cases with the share of negative mentions behind each
- Filter by source: app reviews, external reviews, chat, mail, calls
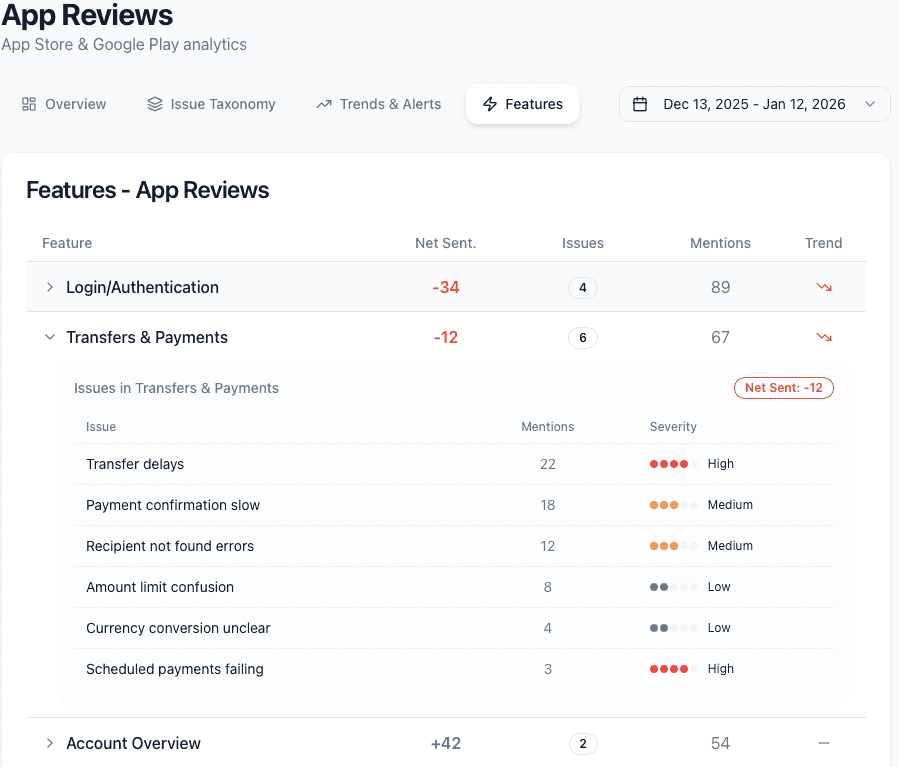
Which features matter most, and which ones hurt.
Feature impact ties net sentiment, issue counts and trend to the features you name. You decide what to track. Compethic does the reading and the counting.
- Net sentiment per feature over time
- The issues and mentions behind each feature
- Track a feature, a product or a metric you define yourself
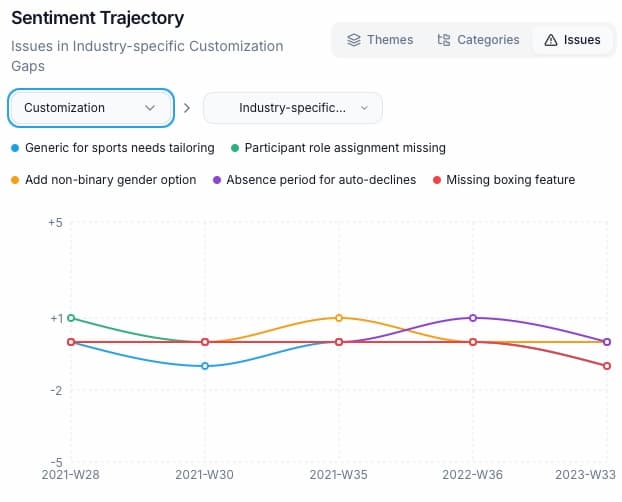
Measure whether the change worked.
A sentiment trajectory per issue, with releases and fixes on the same timeline. If the complaints stopped, you see it. If they moved somewhere else, you see that too.
- Trend per issue, week by week
- Strengths kept next to issues, so you know what not to break
- Emerging themes flagged before they are big enough to be a top issue
What you get.
One structure for every channel
Theme, category and issue, shared across reviews, mail, chat, calls and surveys, so the same problem is one problem everywhere.
Pain points with severity
What the customer actually struggled with, as a recurring condition: UX, technical, performance or price, high to low.
Sentiment, intent and strengths
Every mention is an issue, a strength or a question. Strengths are kept, so the picture is honest in both directions.
Journey stages and use cases
Where in the lifecycle the customer was and what they were trying to do, with the outcome.
Sources side by side
Compare what app reviews say with what support mail says. Different channels, same structure.
Ask Compethic
Ask for the top issues in onboarding this month and get the count, the quotes and the customers, from the same data as the dashboard.
Everything Compethic does follows one loop.
See it on your own feedback.
Bring one channel. We connect it, run the analysis and walk you through what came out, on your data, not a demo set.
Fields marked * are required.